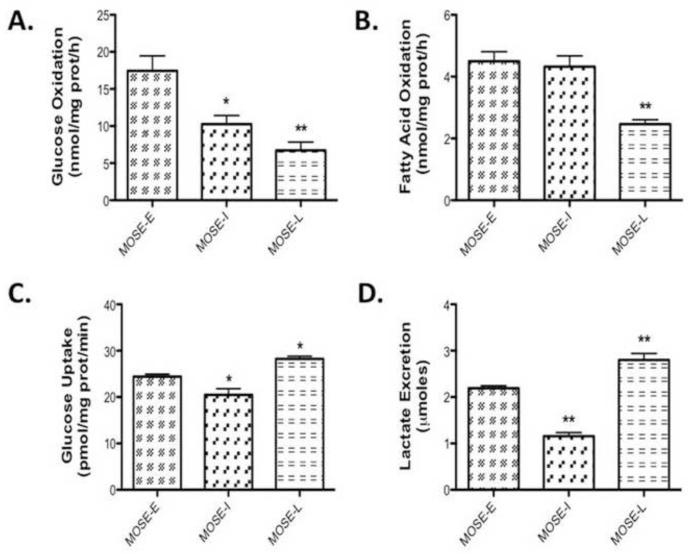
Figure 1. MOSE cancer cell progression results in a glycolytic phenotype.
Cells were incubated in serum-free medium for 2h, the appropriate substrates added and changes in (A) glucose oxidation at 3 h, (B) fatty acid oxidation at 3 h, (C) lactate secretion at 8 h and (D) glucose uptake at 10 min in early (MOSE-E) intermediate (MOSE-I) and late (MOSE-L) stages of ovarian cancer were measured as described under methods. Data are presented as mean ± SEM. Different from MOSE-E, *p 0.01, **p 0.001.

