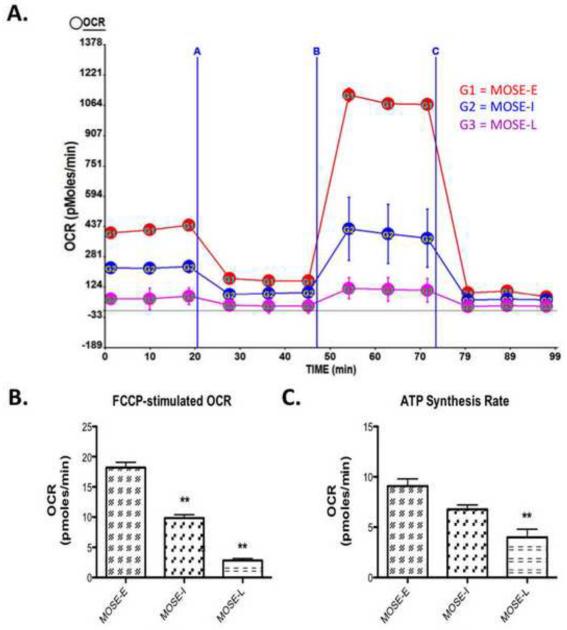
Figure 5. Oxidative Capacity Rate is reduced in a step-wise manner during MOSE cell progression.
Oxidative capacity rate (OCR) was measured during an uncoupling challenge. Cellular respiration was modified by oligomycin, an ATP synthase blocker, carbonylcyanide-p-trifluoromethoxyphenyl hydrazone (FCCP), an electron transport chain uncoupler followed by rotenone, a complex one inhibitor of the electron transport chain. (A) Image of representative experiment where A is oligomycin treatment, B is FCCP treatment and C is rotenone treatment, measured over 2 h; (B) Change over base-line in OCR after FCCP treatment; (C) ATP synthesis rate as calculated by the difference between basal OCR and oligomycin blocked OCR. Data are presented as mean ± SEM. Different from MOSE-E, **p 0.001.

