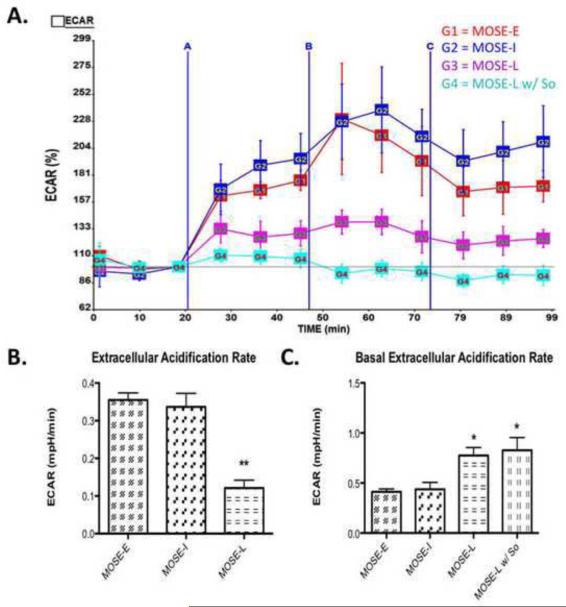
Figure 6. Extracellular Acidification Rate (ECAR) shows an increase in glycolysis during MOSE cell progression.
Extracellular acidification rate (ECAR), an indication of the rate of glycolysis was modified by oligomycin, carbonylcyanide-p-trifluoromethoxyphenyl hydrazone (FCCP), and rotenone (see Fig.5). (A) Image of representative experiment where A is oligomycin treatment, B is FCCP treatment and C is rotenone treatment, measured over 2 h; (B) Change in ECAR over baseline after olygomycin treatment, where So treatment for 3 passages decreased glycolysis rate; (C) Basal ECAR levels in MOSE cells, where MOSE-L and MOSE-L w/ So treatment have an increased rate of glycolysis at basal conditions. Data are presented as mean ± SEM. Different from MOSE-E *p 0.01, **p 0.001.

