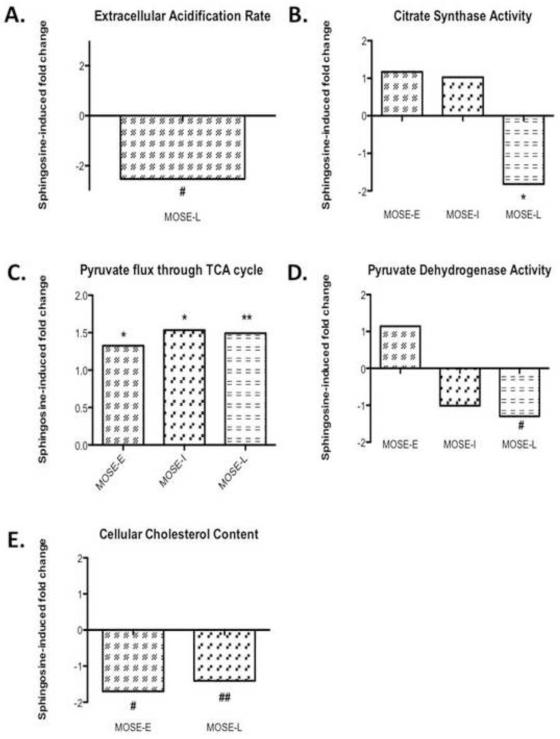
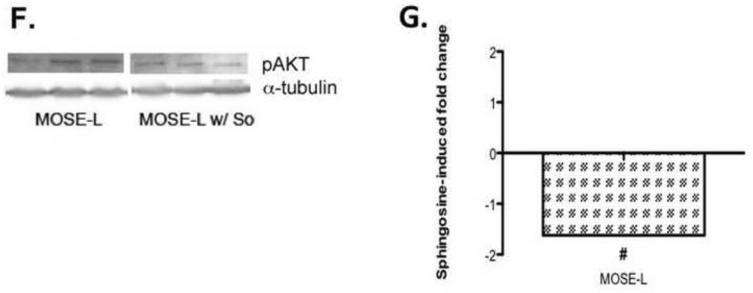
Figure 7. Sphingosine-induced changes restore a more oxidative phenotype.
Changes in (A), extracellular acidification rate (ECAR), (B) citrate synthase activity, (C) pyruvate flux through TCA, (D) pyruvate dehydrogenase activity, (E) cholesterol content, (F, G) p-AKT protein content upon sphingosine (So) treatment in three replicates of MOXE-L (first three bands) MOSE-L cells treated with sphingosine (So) (last three bands). Data are presented as fold-differences from untreated controls. Different from untreated controls #p 0.05, *p 0.01, **p 0.001, ##p=0.055.


