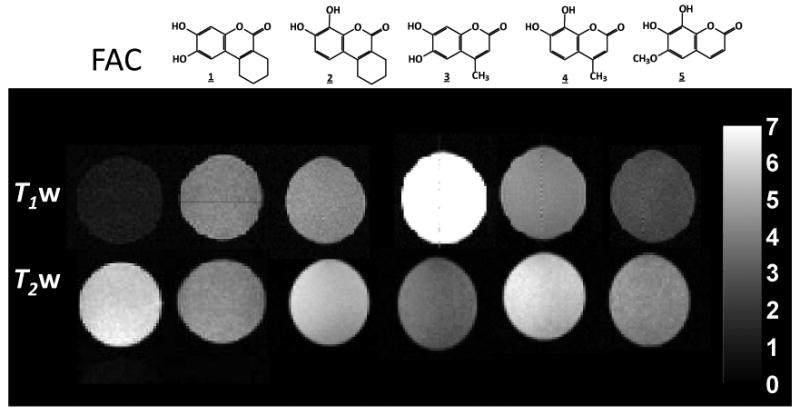
Figure 1. Comparison of MRI Contrast for aglycone ligands 1-5 with Fe3+.

200 MHz 1H MRI of vials of ferric ammonium citrate (FAC) (3.0 mM) in PBS/DMSO (V/V′ 1:1) alone (leftmost) or mixed with ligands shown above (1-5; 9.0 mM). Upper row of images: T1-weighted 1H MRI with TR = 300 ms, TE = 20 ms, 1.5 mm slice with, 128 × 128 resolution over 50 × 50 mm2. Lower row Corresponding T2-weighted 1H MRI with TR = 2000 ms, TE= 80 ms.
