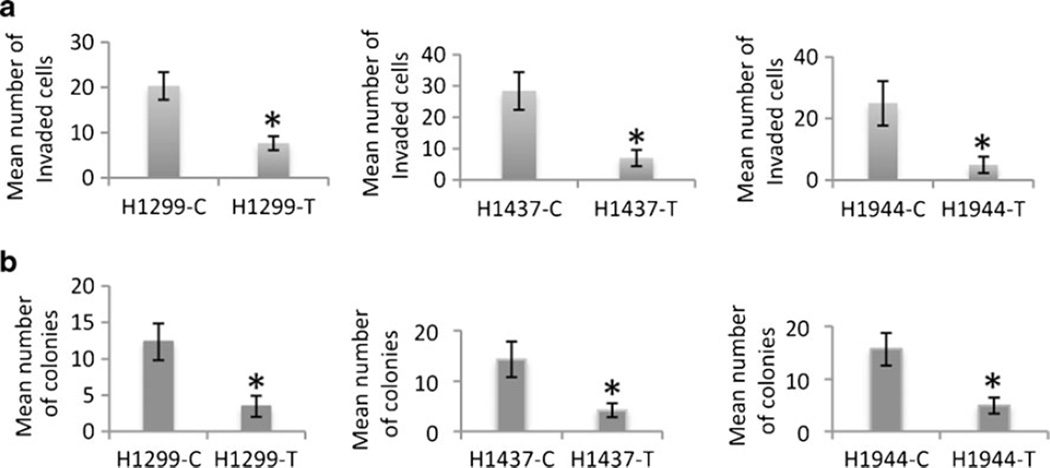
Fig. 4.
In vitro invasion potential and anchorage-independent growth capabilities of the transfected cells. a Compared to the empty vector-transfected groups, the number of invaded cells significantly decreased (p=0.029–0.049, indicated by asterisk) in the wt-SH3GL2-transfected group. b Number of soft agar colonies was significantly decreased (p= 0.023–0.039, indicated by asterisk) in the wt-SH3GL2-transfected group

