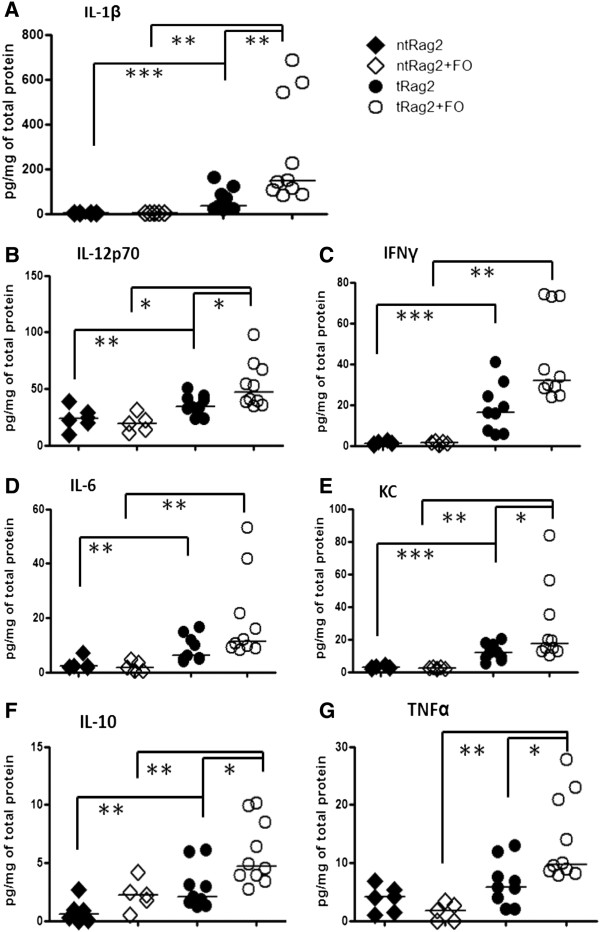
Figure 3.
Cytokine measurements in colon tissue. IL-1β; IL-12p70; IFNγ; IL-6; KC; IL-10 and TNFα are shown (from A-G respectively). Black bars are median values and each dot represents the value obtained with an individual mouse. Statistics are shown as * when P <0.05, ** when P <0.01 and *** when P <0.001.

