
Figure 2. Linear free energy relationships of rate and equilibrium binding constants upon mutation.
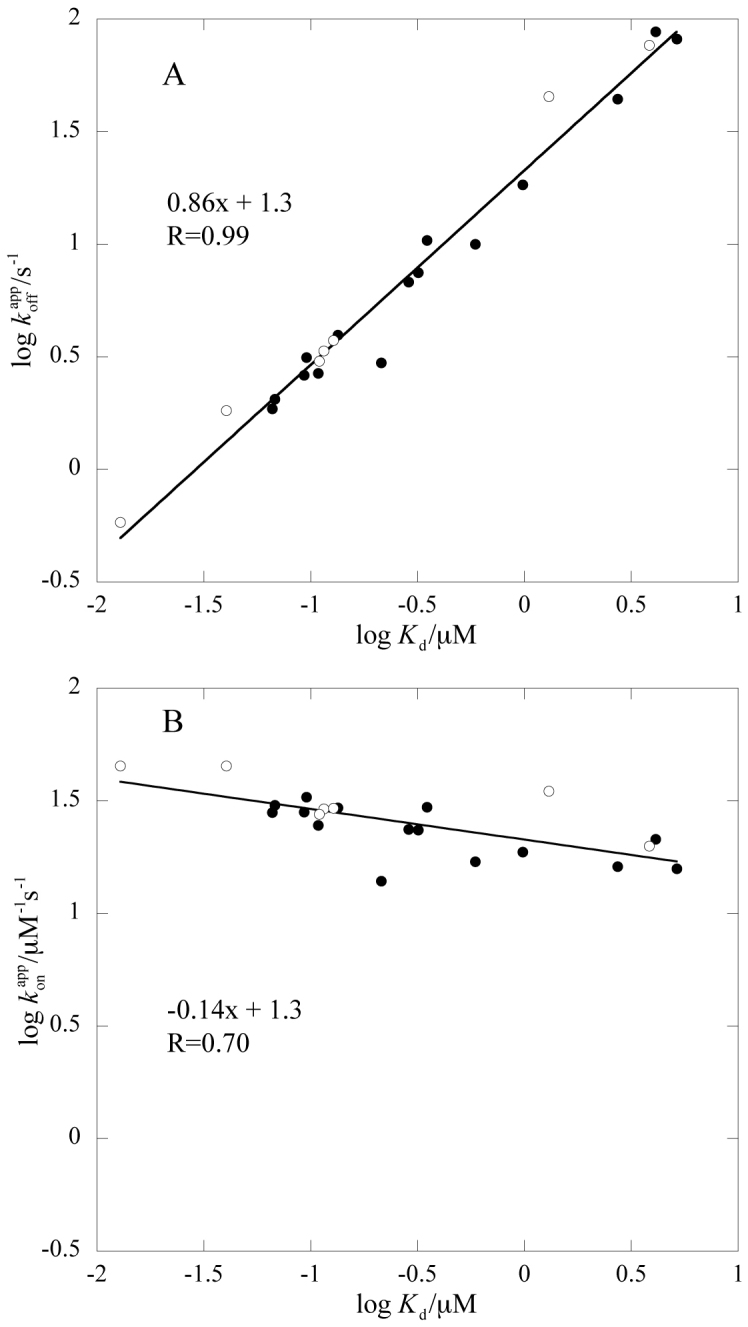
(A) log koffapp versus log Kd and (B) log konapp versus log Kd. Solid circles represent data that were obtained in 20 mM phosphate (pH = 7.4), 150 mM NaCl, whereas constants that were obtained in the same buffer but supplemented with 0.7 M TMAO are shown as open circles.