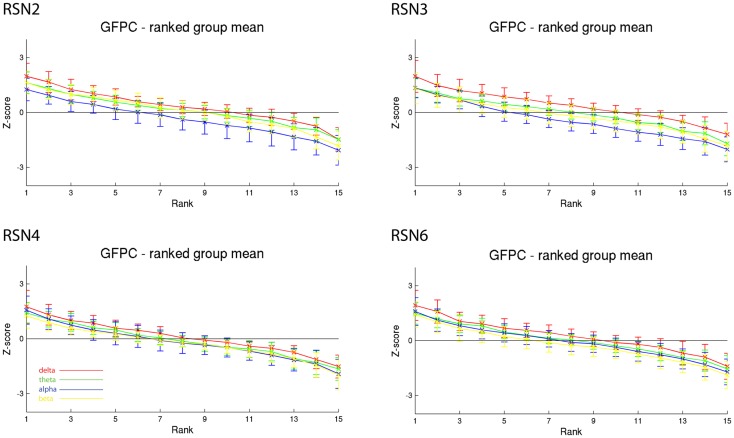
Figure 4.
Exemplary group results of RSN2 (occipital visual component), RSN3 (lateral visual component), RSN4 (DMN), and RSN6 (sensory motor component) for GFPC as rank graph showing large temporal variance within a subject. The error bars (standard deviation across subjects) show the considerable inter-subject variability. Clearly alpha power shows a more negative correlation with the BOLD signal whereas delta power shows a more positive correlation for the visual components. Note that the connecting lines are only for visualization purposes.

