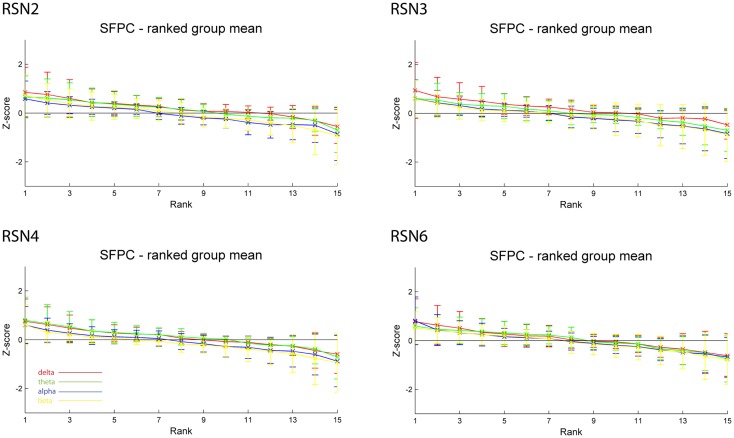
Figure 5.
Exemplary results of RSN2 (occipital visual component), RSN3 (lateral visual component), RSN4 (DMN), and RSN6 (sensory motor component) for the five analyzed subjects using SFPC comparable to Figure 4. The error bars (standard deviation across subjects) show the considerable inter-subject variability, which is higher compared to GFPC; note that the Z-scores are smaller compared to GFPC. Despite these differences, also when using SFPC, alpha power shows a more negative correlation with the BOLD signal whereas delta power shows a more positive correlation for the visual components. The connecting lines are only for visualization purposes.

