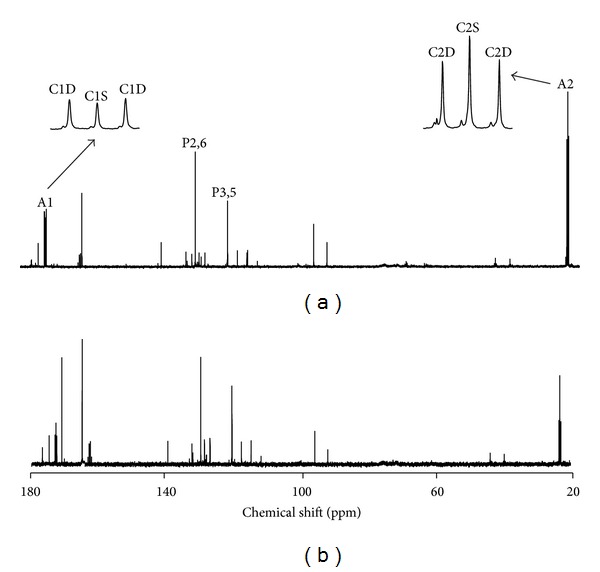
Figure 1.

13C NMR spectra of urinary N-acetyl PABA derived from mice whose drinking water was supplemented with 8.75% [U-13C]fructose/8.75% unlabeled fructose/17.5% [1-13C]glucose (a) and 2.5% [U-13C]fructose/2.5% unlabeled fructose/5% [1-13C]glucose (b). Spectra are scaled to the N-acetyl PABA aromatic 13C-signals of the 2,6 ring carbons (P2,6) and the 3,5 ring carbons (P3,5). For spectrum A, the N-acetyl resonances of carbon 1 (A1) and carbon 2 (A2) are shown in expanded form featuring the singlet (C1S, C2S) and doublet (C1D, C2D) components. Signals from N-acetyl-p-amino hippuric acid can be seen as small shoulders to the left-hand side of each of the carbon 1 and 2 multiplet components.
