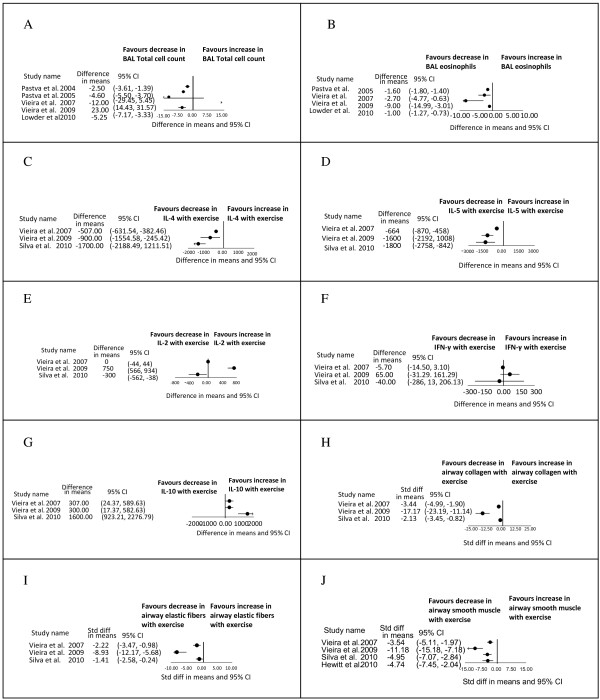
Figure 2.
Forest plots of results. A) Bronchoalveolar lavage total cell counts (cells* 105). B) Bronchoalveolar lavage eosinophils (cells* 105). C) Peribronchial density of cells positive to Interleukin-4 (Il-4) (cells/mm2). D) Peribronchial density of cells positive to Interleukin–5 (Il-5) (cells/mm2). E) Peribronchial density of cells positive to Interleukin-2 (Il-2) (cells/mm2). Note: in the graphical data presented in the original paper by Silva et al. 2010, there is no change in IL-2 with exercise, but our conversion to numerical data was imperfect and makes it look as if there is a change when in fact there was not. F) Peribronchial density of cells positive to Interferon-γ (IFN- γ) (cells/mm2). Note: in the graphical data presented in the original paper by Vieira et al. 2009, there is a significant increase in IFN-γ, but our conversion to numerical data was imperfect and makes it look as if there is no significant change, when in fact there was a significant change. G) Peribronchial density of cells positive to Interleukin-10 (Il-10) (cells/mm2). H) Airway collagen fibers (Silva: % area, Vieira 2007: % volume, Vieira 2009: % volume). I) Airway elastic fibers (Silva: % area, Vieira 2007: % volume, Vieira 2009: % volume). J) Airway smooth muscle fibers (Silva: %, Vieira 2009: index, Vieira 2007: area, Hewitt: microns).

