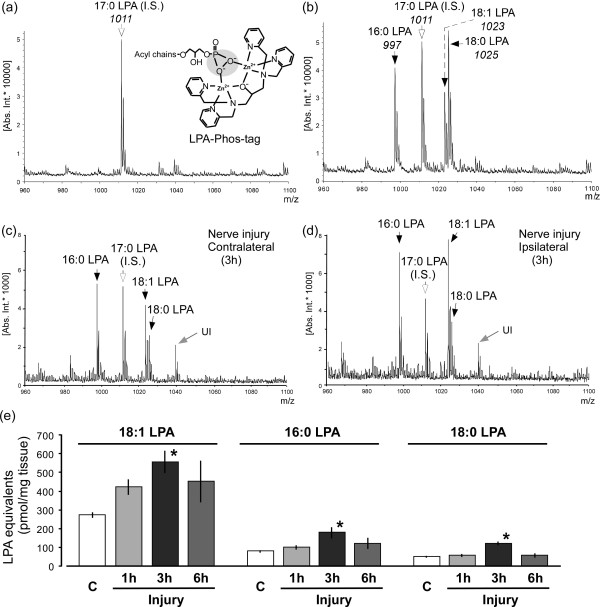
Figure 1.
Biosynthesis of LPA following nerve injury by MALDI-TOFMS using Phos-tag. (a and b) Representative charts of mass spectra with internal standard 17:0 LPA (panel a), and mixed standard reagents 16:0, 18:0 and 18:1 LPA as well as internal control (panel b) at the level of 0.2 nmol, following the use of Phos-tag. (c and d) Mass spectra of LPA extracts from the contralateral (panel c) and ipsilateral (panel d) dorsal half of spinal cord at 3 h after nerve injury. “UI” represents the unidentified compound. (e) Levels of produced LPA species (18:1, 16:0, 18:0 LPA) in spinal cord preparations of control or injured mice. The capital letter “C” represents the control group (naive mice). Data represent means ± SEM from experiments using 3-8 mice. *p < 0.05, versus with the control group.

