Figure 1.
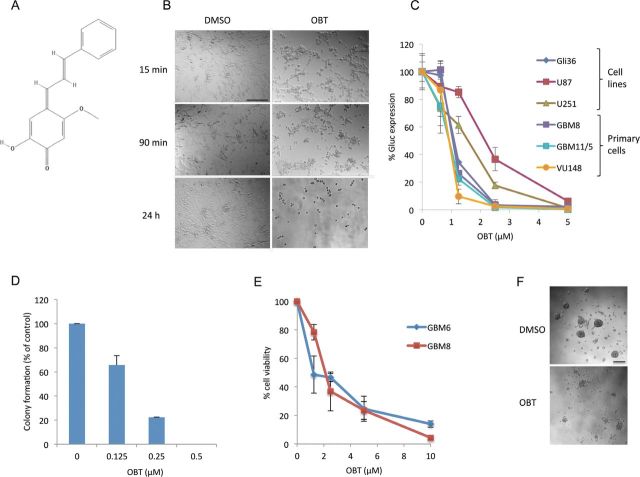
Effect of obtusaquinone (OBT) on glioblastoma cells. A) Chemical structure of OBT. B) Effect of OBT on U87 cells. Cells were treated with 5 µM OBT or dimethyl sulfoxide vehicle control. Note the change in cellular morphology at early time points (15 minutes) after treatment. C) OBT toxicity on Gli36, U87, and U251 glioma cell lines and three primary glioblastoma (GBM) cells all expressing Gluc. Cells were treated with the indicated doses and Gluc activity was measured 24 hours later. Data are presented as percentage Gluc expression in which the control untreated sample is set at 100%. D) OBT effect on U87 long-term growth was assessed through colony-forming assay. Cells at low confluency were treated with OBT for 16 hours and allowed to recover in growth medium in the absence of OBT for 12 days. Colonies were counted and plotted as percent of the control. E) OBT effect on survival of GBM stemlike cells. The cells were allowed to form neural spheres before addition of the compound. Cell viability was measured after 24 hours of treatment. F) Microscopy images showing neurosphere disintegration 24 hours after treatment with 10 µM OBT. The average of experimental triplicates (± SD) is shown in (C–E). Scale bar = 100 µm.

