
Figure 7.
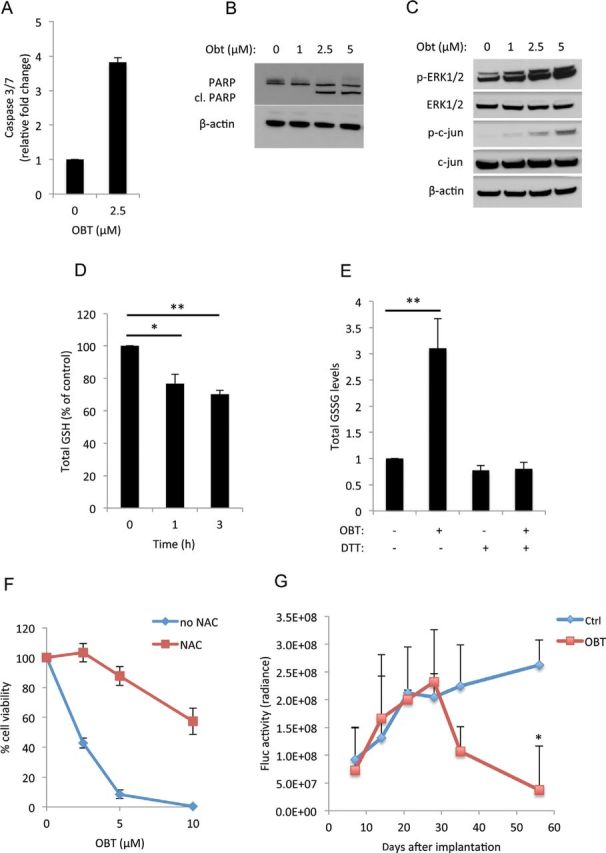
Obtusaquinone (OBT) effect on MDA-MB231 Br breast cancer cell model. A–C) MDA-MB231 Br cells treated with OBT for 24 hours before measuring caspase 3/7 activity (A) and the expression of PARP and its cleaved form (cl. PARP) (B) or treated for 1 hour and analyzed for the expression of phospho and total ERK1/2 and phospho and total c-jun. β-Actin for normalization of protein loading (C). D) Gluthathione (GSH) quantification; cells treated with 2.5 µM OBT for the indicated time points were lysed, and the total GSH levels were measured. E) Quantification of the oxided form of GSH (GSSG); cells treated with 2.5 µM OBT in the presence or absence of dithiothreitol (DTT) (1mM) for the 6 hours before GSSG levels were measured F) Cell viability after 24 hours of treatment with OBT in the presence of absence of N-acetly-L-cysteine (NAC) (3mM). All experiments were performed in triplicates. Error bars represent SD. G) MDA-MB231 Br cells expressing Fluc were injected into the mammary fat pad of nude mice and allowed to form tumors. Mice were separated into control (Ctrl) group (n = 6) and OBT group (n = 6) and treated as described above. Bioluminescence imaging signals were calculated and presented as the average radiance ± SD. *P < .05 and **P < .01 two-sided Student t test.