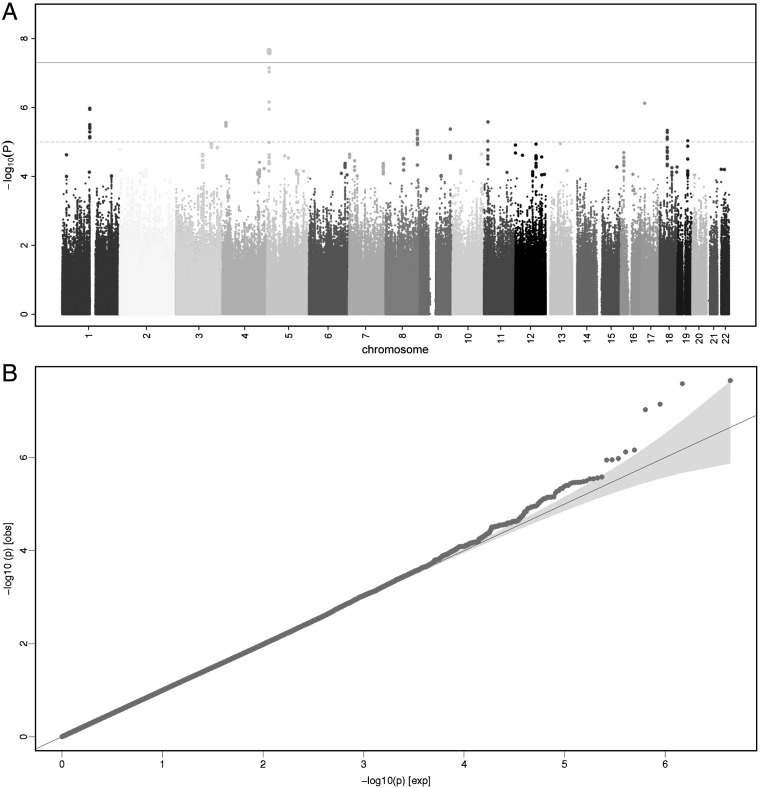
Figure 2.
Genome-wide association results for chronic widespread pain (CWP) (stage 1). (A) Manhattan plot showing the p value of association tests for about 2 million SNPs with CWP in the stage 1 meta-analysis. SNPs are plotted on the x-axis according to their position on each chromosome. On the y-axis, the association p values with CWP are shown (as −log 10 p values). The grey solid horizontal line represents the p value threshold of 5×10⁻⁸ (genome-wide significance). The grey dashed horizontal line represents the p value threshold of 1×10⁻⁵ (the level for suggestive evidence): SNPs in loci reaching 1×10⁻⁵ were tested for replication. (B) Quantile–quantile (QQ) plot of SNPs. The blue area represents the 95% CI around the test statistics. A QQ plot compares the additive model statistics to those expected under the null distribution using fixed effects for all analysed HapMAP CEU imputed SNPs passing quality control criteria. This figure is only reproduced in colour in the online version.

