
Figure 2. Fetal Exposure Group Differences for Fluency and Originality.
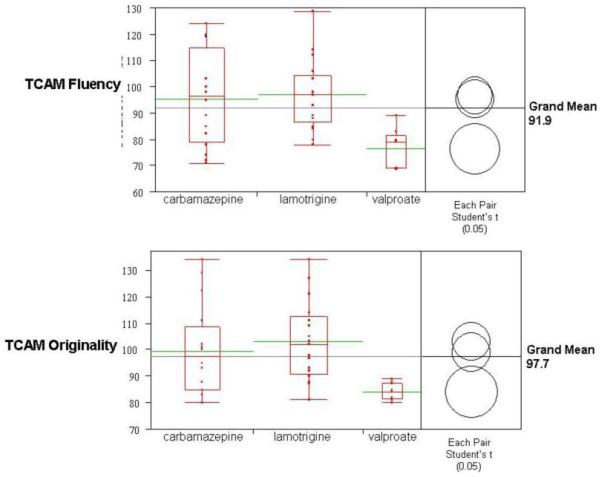
The horizontal grey lines indicates ANOVA grand means (fluency=91.9; originality=97.7). The boxplots for each AED exposure group show (a) individual performance (red data points arrayed vertically), (b) the interquartile range (top and bottom of the box), (c) group means (green horizontal bars), and (d) group distribution (spread of the “tails” or “whiskers”). The comparison circles compute individual pairwise comparisons using Student’s t-tests. Each circle corresponds to a drug exposure group: If the mean for one drug group is significantly different than the mean for another drug group, their circles do not intersect, or their circles intersect slightly, so that the outside angle of intersection is less than 90 degrees, as is the case with the valproate group versus the carbamazepine and lamotrigine groups (i.e. fluency mean = 76.3, with p-value = 0.003 for carbamazepine and p-value = 0.001 for lamotrigine). If the circles intersect by an angle of more than 90 degrees, or if the circles are nested, the means are not significantly different, as is the case with the carbamazepine and lamotrigine groups.