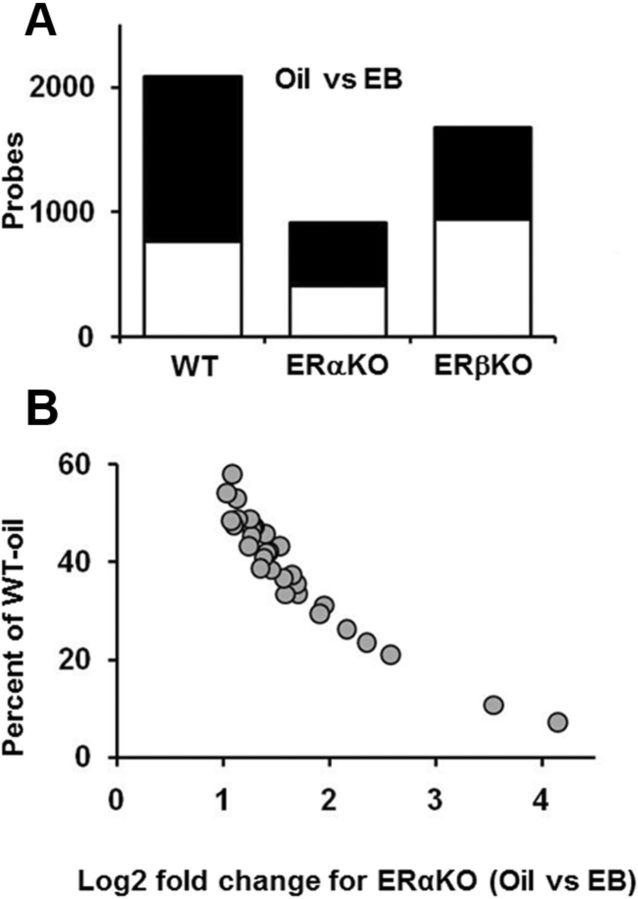
Figure 7.
Gene expression in middle-age WT and ERKO mice, 24 h after the last estradiol (WT = 14, ERαKO = 8, ERβKO = 11) or oil (WT = 15, ERαKO = 7, ERβKO = 12) treatment. A, Graphic summary of the total number of probes that increased (open) and decreased (filled) in WT-EB, ERαKO-EB, and ERβKO-EB-treated mice compared with genotype-matched oil-treated counterparts. WT and ERβKO mice exhibited ∼2 times more genes whose expression was altered by estradiol relative to ERαKO mice. B, Expression of 31 probes in ERαKO mice normalized to expression in WT-oil mice. Basal expression for ERαKO-oil mice is plotted on the y-axis, and the increase in expression observed in ERαKO-EB mice is plotted on the x-axis as the log2 fold change.

