
Figure 3.
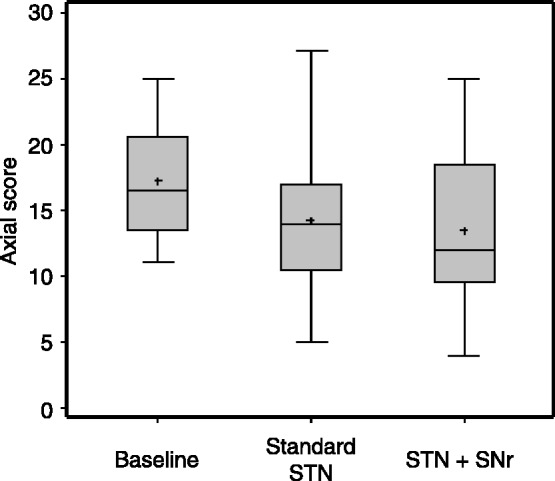
Primary endpoint at ‘3-week follow-up’. Results are given as box plots. x-axis: therapeutic condition; y-axis: axial score. [STN+SNr] = combined STN+SNr stimulation.
Official websites use .gov
A
.gov website belongs to an official
government organization in the United States.
Secure .gov websites use HTTPS
A lock (
) or https:// means you've safely
connected to the .gov website. Share sensitive
information only on official, secure websites.
Primary endpoint at ‘3-week follow-up’. Results are given as box plots. x-axis: therapeutic condition; y-axis: axial score. [STN+SNr] = combined STN+SNr stimulation.