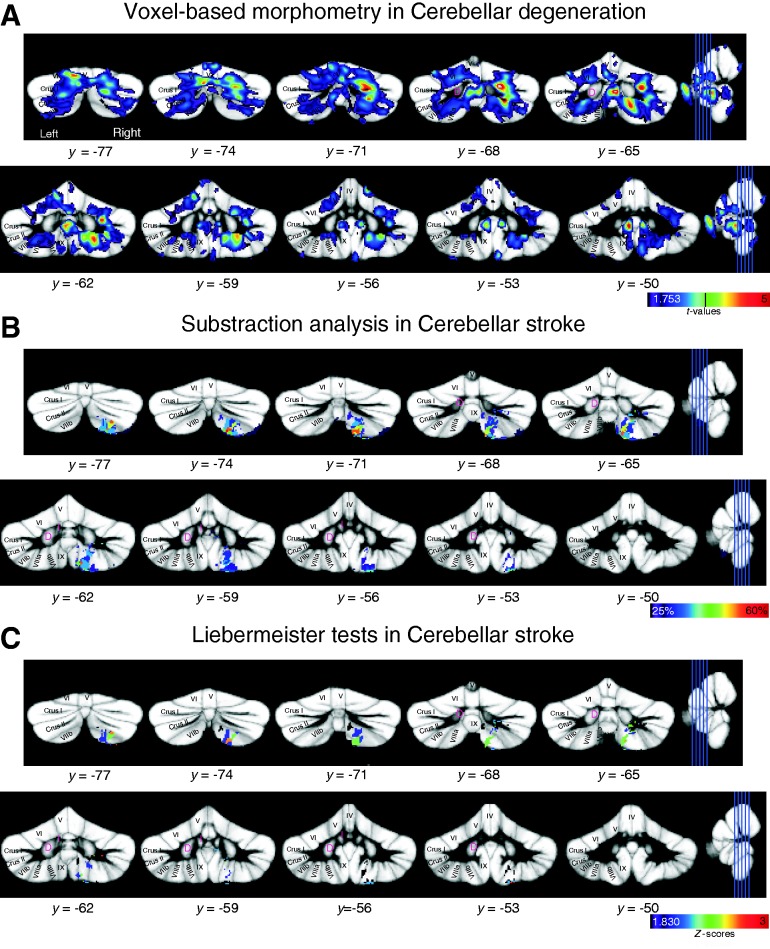
Figure 8.
Results of lesion–symptom mapping superimposed on the SUIT probabilistic atlas template (Diedrichsen et al., 2009). Y-values indicate the coordinate in SUIT space. (A) Voxel-based morphometry in patients with cerebellar degeneration. Cerebellar areas are shown with a positive correlation between conditioned eye-blink response incidence and grey matter values. Results are thresholded at P < 0.05, uncorrected. Colour code indicates t-values, and t-value corresponding to P < 0.001 uncorrected is indicated by a vertical line (t = 3.73). (B) Subtraction analysis in patients with focal lesions due to stroke. Cerebellar areas are shown that are more likely to be lesioned in patients with an abnormally low conditioned eye-blink response incidence. Colour code represents % consistency with a threshold of 25%. All lesions were flipped to the same side. (C) Liebermeister tests in patients with focal lesions due to stroke. Cerebellar areas are shown that are more likely to be lesioned in patients with an abnormally low conditioned eye-blink response incidence. Results are thresholded at P < 0.05 FDR corrected, Z-score = 1.83. Colour code indicates Z-scores. All lesions were flipped to the same side.

