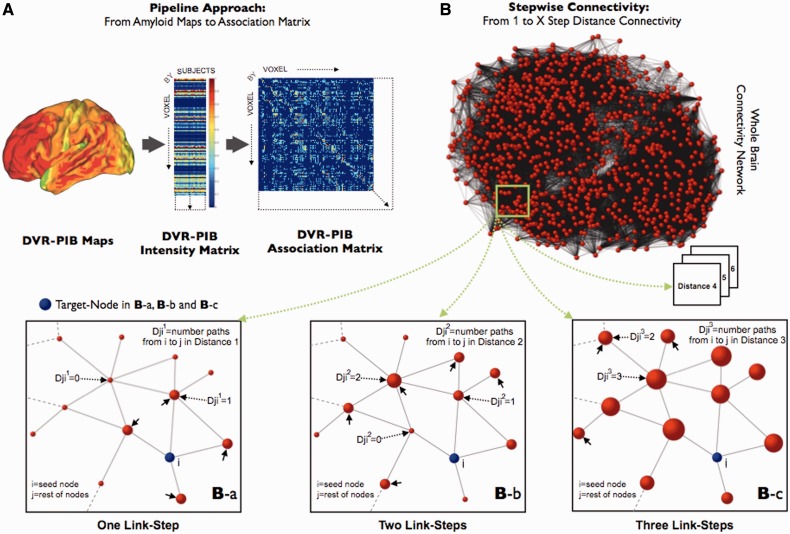
Figure 1.
Stepwise connectivity method in PIB-PET images. (A) Main steps of the pipeline approach of the study, from conventional PIB images to association matrix. 11C-PIB PET images, transformed to distribution volume ratio maps (DVR), were used to obtain group-level intensity matrices (voxels × subjects). Later, group-specific association matrices were calculated by applying the Pearson R correlation coefficient between all pair of voxels. Finally, we use the association matrices to achieve FDR corrected adjacency matrices and build the specific graphs for each study group. (B) Simplified diagram of the stepwise connectivity (SC) method [figure partially adapted from Sepulcre et al. (2012b)]. Stepwise connectivity analysis takes advantage of the whole connectivity association matrix and analyses the connectivity patterns of target regions using a wide range of link-step distances. Briefly, from any node (j; red nodes) in the brain, we compute the number of pathways that connect to a voxel in an a priori target node (i; blue node) with a particular number of links l (Djil where l is the specific link-step distance). In the ‘One Link-Step’ case, only direct connections to the target are considered (small arrows in Ba). In higher order step distances, connectivity patterns beyond direct connections are obtained (Bb and c). Note that for schematic purposes only one target voxel-node (blue colour) is displayed in Ba–c.

