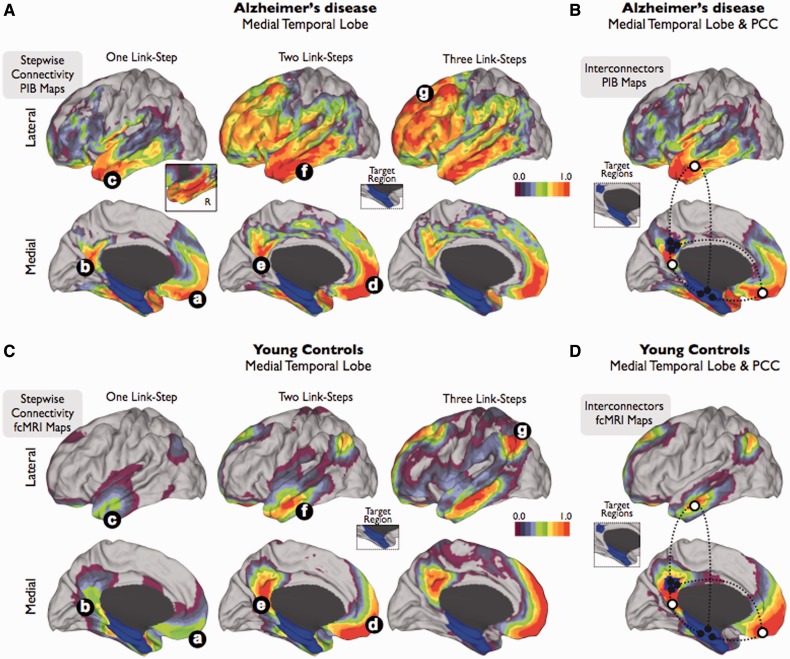
Figure 2.
Stepwise connectivity analysis of medial temporal lobe and interconnector analysis of medial temporal lobe and posterior cingulate cortex in PIB-PET images of patients with Alzheimer’s disease (A and B) and in functional connectivity MRI images of young controls (C and D). Inset in A shows the contralateral amyloid-β connectivity in one-step. Colour bars represent a normalized colour scale from 0 to 1, where 0 is the intensity corresponding to z-score equal to zero and 1 is the maximum z-score.

