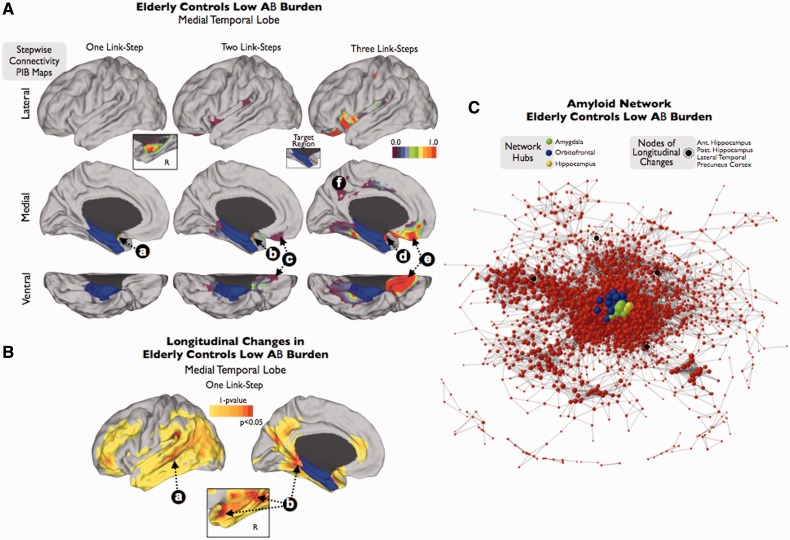
Figure 4.
Stepwise connectivity analysis of medial temporal lobe (A and B) and visualization of the amyloid network (C) in elderly controls with very low amyloid-β burden. Inset in A shows the contra-lateral amyloid-β connectivity in one-step. In the network graph (C), size of nodes represents degree centrality values (larger nodes denote high number of connections to the rest of the network). Colour bars represent normalized z-score scale in A; and 1 minus P-value scale in B.

