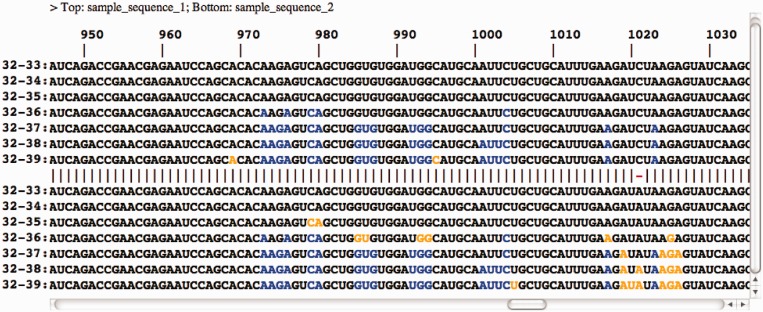
Figure 1.
Comparison of significantly changing positions between two RNAs. Top and bottom halves of the figure demonstrate influenza strains A/Leningrad/134/57 and its cold-adapted temperature-sensitive mutant A/Leningrad/134/47/57, respectively. Each row corresponds to a particular temperature difference. Positions in which base pairing probabilities significantly change with temperature elevation in both sequences and those where these changes only affect one of the sequences are marked blue and orange, respectively. Position numbers are indicated at the top of the alignment.

