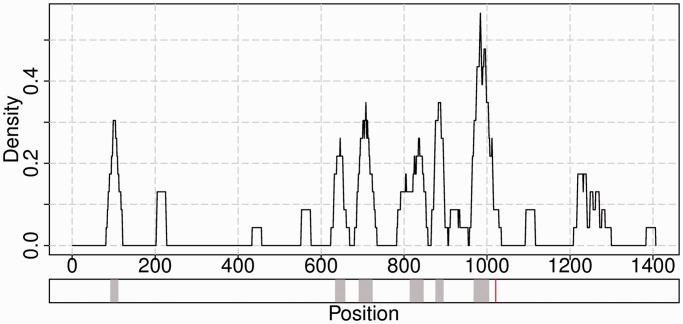
Figure 4.
The upper panel demonstrates a density plot of significantly changing positions along the input sequence. A sliding window of size 2*ε + 1 is moved in steps of 1 position over the sequence with the highest temperature difference t2 − t1. The percentage of significantly changing positions in the window is calculated for each possible starting position. The bottom panel shows location of clusters of significantly changing positions identified by the DBSCAN algorithm depicted with gray color, and mutation is depicted with red vertical line. The depicted mutation corresponds to the nucleotide difference between influenza strains A/Leningrad/134/57 and its cold-adapted temperature-sensitive mutant A/Leningrad/134/47/57.

