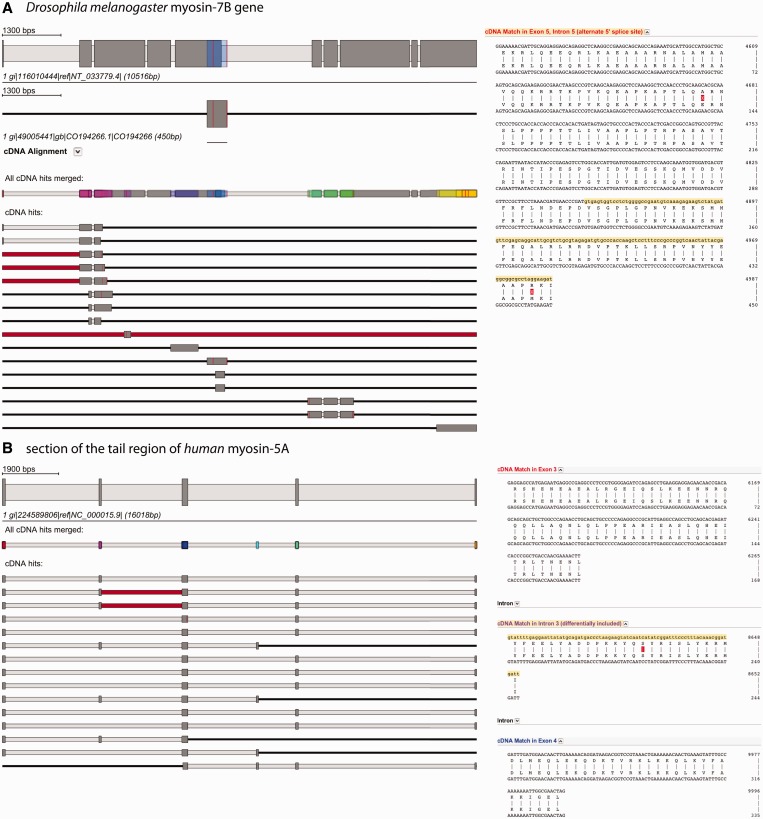
Figure 3.
Alternative splice variants are detected by mapping EST/cDNA onto the reconstructed gene. (A) The example shows the search for alternative splice variants in the Drosophila melanogaster myosin-7B gene. The gene structure on top displays the reconstructed gene. All EST/cDNA clones mapping to the gene are listed below (red bars represent parts of the clones that do not map to the query gene, red lines represent single mismatches), and every of them can be activated by clicking for further inspection (second scheme from top). The position, where this specific clone is mapping onto the query gene, is shown in colour (blue bar on the myosin-7B gene structure). Always, a merged scheme is shown, in which all regions of the query gene, to which EST/cDNA clones mapped, are highlighted in colour (third scheme from top). This should provide the user an overview about the regions covered when dozens to hundreds EST/cDNA clones map. The spliced alignment on the right represents the section of the alignment result view that contains the suggested alternative splice variant and is displayed by clicking on ‘cDNA alignment’ below the scheme of this clone. (B) This example shows a section of the tail region of the human myosin-5A gene and a selection of EST clones mapping to it. The red bars in the second and third cDNA clone indicate that part of these clones could not be mapped to the query sequence. The alignment on the right side corresponds to the beginning of the first EST hit. Colours on exon descriptions correspond to the exon, where this part maps (same colour as in the merged EST scheme) and the alternative splice type as suggested by the mapped EST clones is given.

