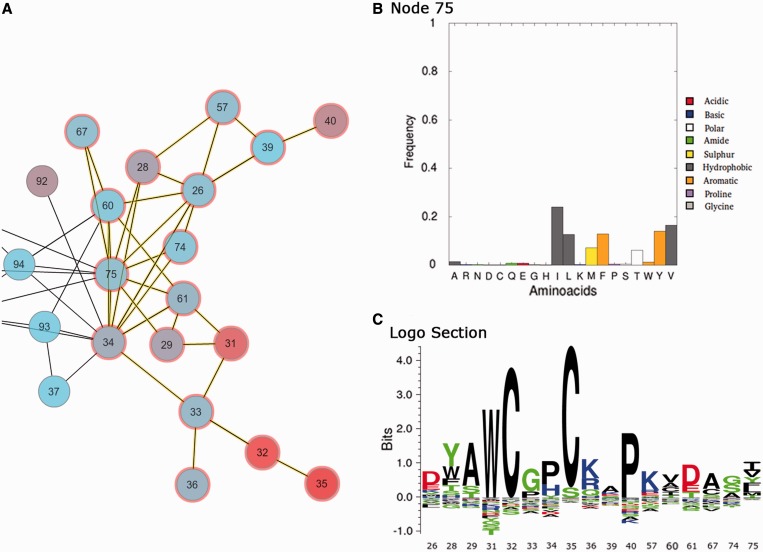
Figure 3.
MISTIC interactive framework showing in panel (A) part of the PF00085 MI network with several nodes and edges selected (selected circles are highlighted in red and selected edges in yellow). Panel (B) shows the amino acid frequency when only one node is selected (e.x: 75). Panel (C) shows the KL sequence logo of the (several) selected nodes.

