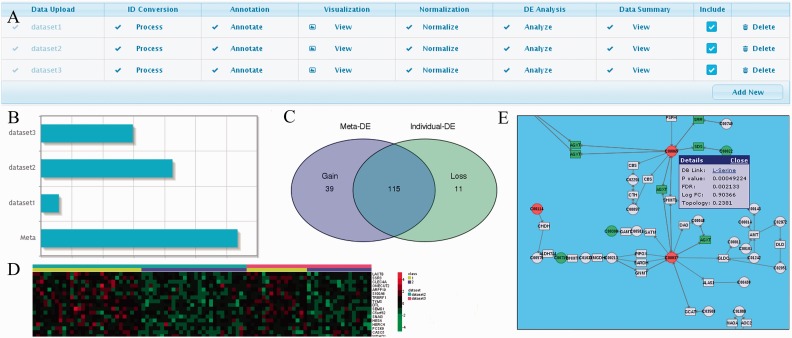
Figure 2.
Some INMEX screenshots. (A) The table allows users to add, process, exclude or delete individual data sets for meta-analysis. Clicking on each table cell will trigger a dialog box to guide users through each step; (B and C) comparison of DE genes derived from meta-analysis and those based on individual data sets. (D) Heatmap visualization of a subset of genes across different studies; (E) visualization of significant genes and metabolites in a metabolic pathway. Red color indicates upregulation and green indicates downregulation. Clicking on each node will show more details.

