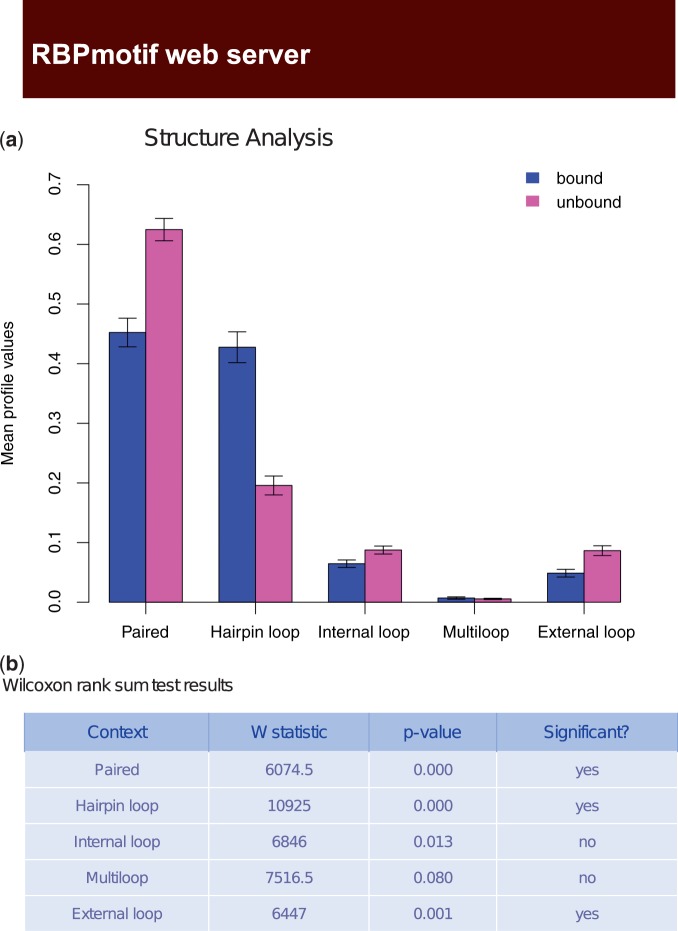
Figure 3.
Result page of the second type of analysis. (a)The bar graph compares the mean profile values of motif instances between bound and unbound sequences. The standard errors of the mean are also shown as error bars. (b) The table shows the results of Wilcoxon’s rank sum test to compare the distribution of structure profiles of motif instances among bound and unbound sequences. The significance threshold for P-values is 0.05 after Bonferroni multiple testing correction.

