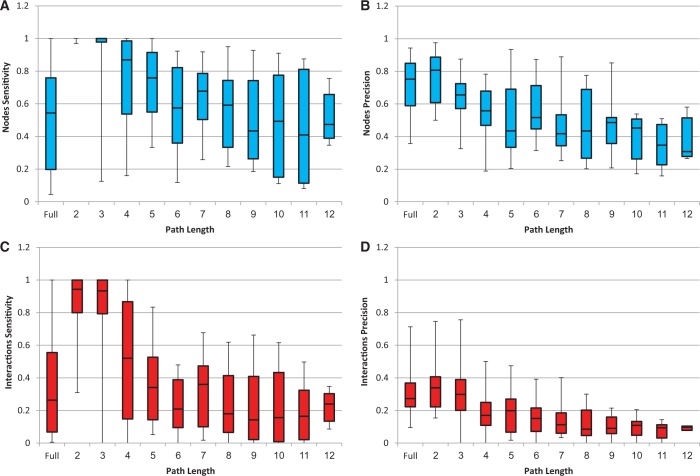
Figure 1.
ResponseNet sensitivity and precision upon analysis of known human pathways. Results are shown for full maps (denoted ‘Full’) and for different path lengths (lengths >12 involved <5 maps and were therefore ignored). Each box-plot diagram shows the quartile values (25, 50 and 75%). (A) Nodes sensitivity. (B) Nodes precision. (C) Interactions sensitivity. (D) Interactions precision. Specificity was 99% in every case and is therefore not shown.

