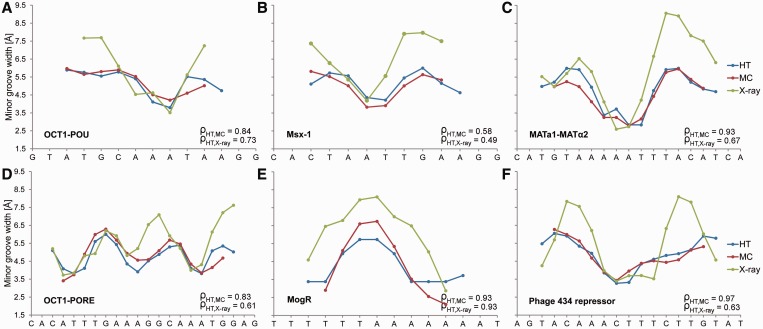
Figure 3.
Validation of HT predictions using protein–DNA binding sites. (A–F) MGW for the DNA binding sites of six proteins, for which DNA shape readout was previously observed (1), are predicted using the HT (blue) and MC (red) approaches and compared with X-ray data (green) of protein–DNA complexes (PDB IDs in Supplementary Materials and Methods). The large positive MGW values observed in X-ray data are usually due to crystal packing and are not observed in solution. Therefore, qualitative MGW patterns (minima versus maxima) are the more essential characteristics compared to actual values. The MGW minima correlate with regions of enhanced negative electrostatic potential, thus providing binding sites for basic arginine side chains (1). Spearman’s rank correlation coefficients (ρ) demonstrate the statistical similarity between the predicted and experimental MGW profiles.

