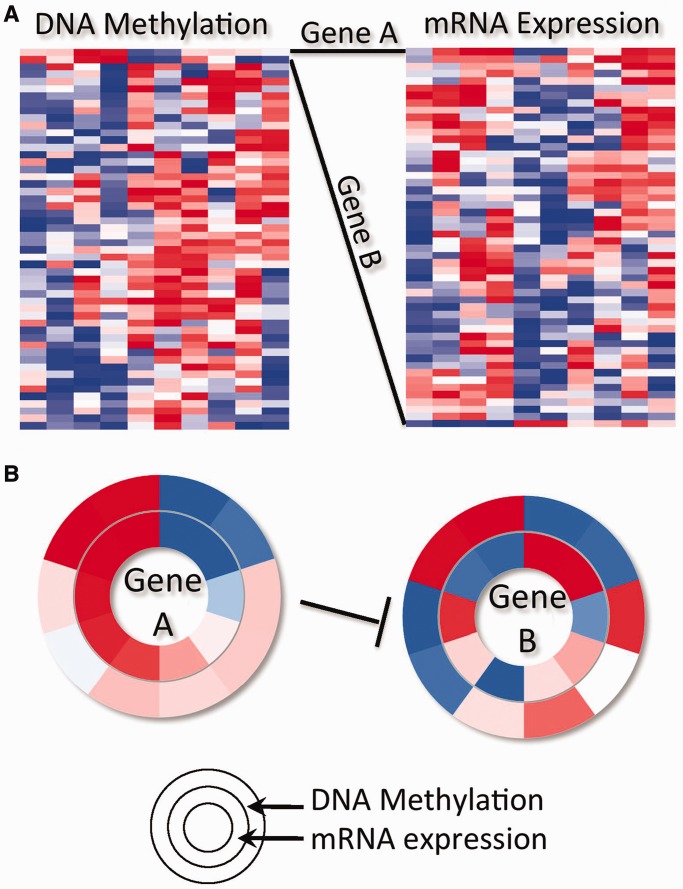
Figure 2.
A toy example illustrating relationship of a CircleMap to a standard heatmap. (A) Left matrix represents DNA methylation data; right matrix mRNA expression data for the same genes (rows) and 10 samples (columns) as for the DNA methylation data. Two genes (gene A and gene B) co-cluster in the DNA methylation data (top) but do not in the mRNA data owing to gene B’s anti-correlation with gene A’s expression. (B) CircleMap shows data across the 10 samples for genes A and B with mRNA expression on the inner ring and DNA methylation on the outer ring. Each ‘spoke’ represents one sample (column) in the heatmap of part A.

