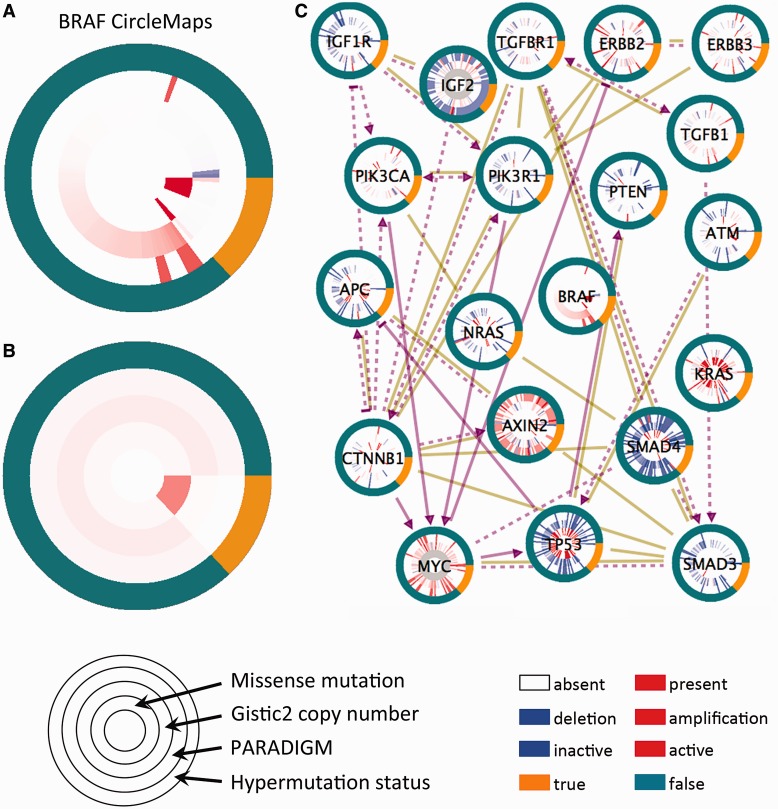
Figure 3.
Case study of the TCGA colorectal adenocarcinoma data set. (A) A zoom-in view of the BRAF oncogene’s CircleMap showing the full detail of all samples as individual spokes. Rings correspond to (inside to outside) somatic missense mutations, copy number estimates from the GISTIC algorithm, PARADIGM pathway inferences and a hypermutation phenotype indicator. (B) Same as in part A but the values within the hypermutated and non-hypermutated groups are averaged within each ring showing the aggregated view. (C) CircleMap display of most of the Wnt-, TGF-beta and PI3K-signaling members regulating MYC oncogene activation. Both curated regulatory links from the UCSC SuperPathway are shown (purple directed links) as well as protein–protein interactions collected from human protein reference database (brown undirected links). All nodes are sorted according to the hypermutated versus non-hypermutated as the primary sort and BRAF mutation as the secondary sort, controllable from the zoom-in on BRAF.

