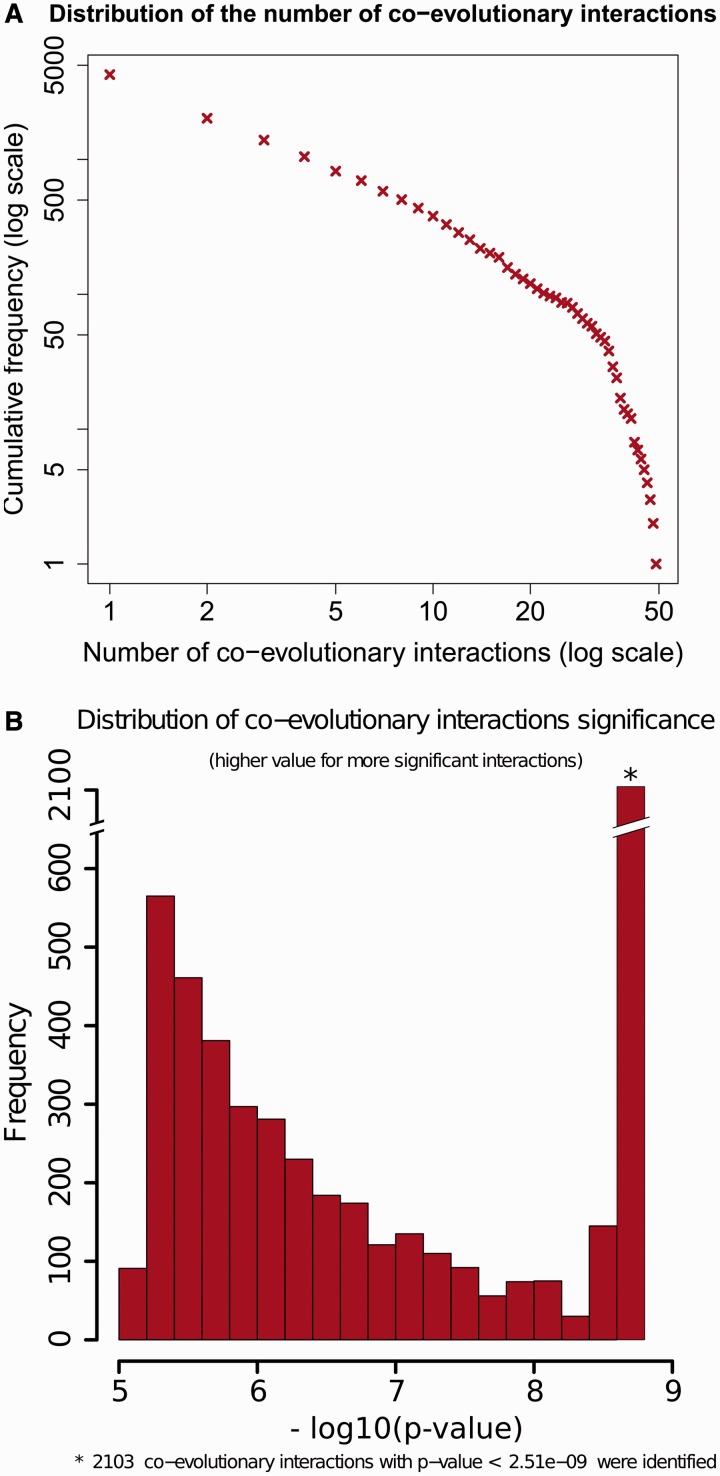
Figure 1.
Global properties of the coevolutionary network. The global properties are illustrated with graphs that are automatically produced by CoPAP. (A) Distribution of the number of interactions. (B) Frequency of various significance levels of coevolutionary interactions. The high frequency for top interactions in this example is the result of limited number of simulations. Thus, all the strongest coevolutionary interactions fall in the top-significance bin with P < 2.51e-09.

