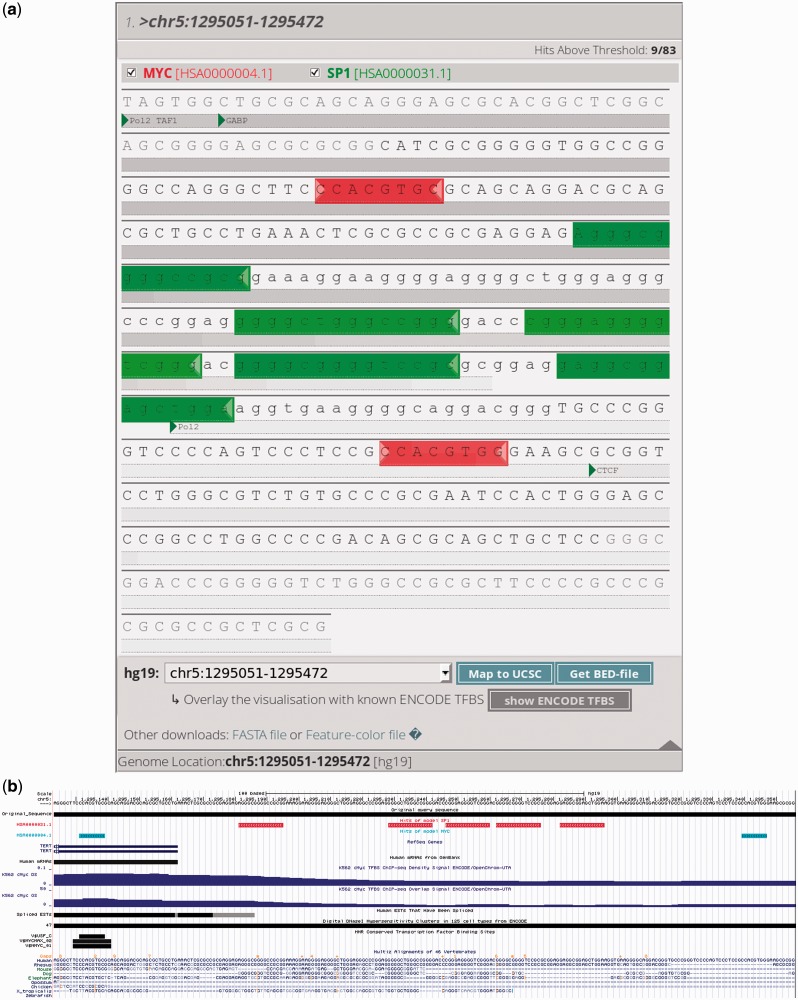
Figure 1.
Example output of the PhysBinder tool. All predicted TFBS match the experimentally determined locations reported by Kyo et al. (12). (a) Detail of the results window: MYC binding sites (E-box) [HSA0000004.1] are shown in red. SP1 binding sites (GC-box) [HSA0000031.1] are shown in green. The default threshold (‘Average’) was used for both models. Gray shaded bars indicate overlapping ENCODE tracks (9). The checkboxes below the sequence indicate the different ENCODE tracks visualized in this sequence. (b) Both models were visualized in the UCSC Genome Browser (11). MYC binding sites are indicated in blue, whereas SP1 binding sites are in red.

