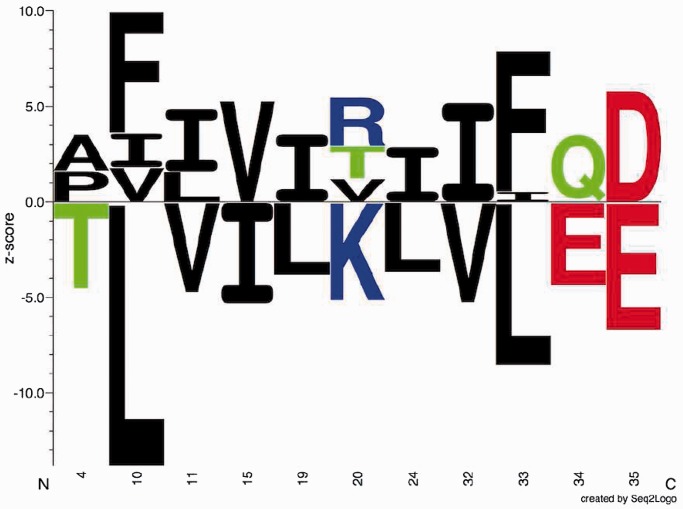
Figure 1.
Sequence logo. Example of sequence logo (13) output from SigniSite from the analysis of the ATV ∼Antivirogram multiple sequence alignment (MSA), truncated to p1 – p35 for the purpose of illustration (see ‘Materials and Methods’ section). The analysis was performed with default settings. On the x-axis are the MSA positions p and on the y-axis the Z-scores for each amino acid residue a ( ). The height of each letter representing the residues is proportional to
  , i.e. the strength of the statistical association between the residue and the data set-phenotype. Residues above the Z = 0 line have a
  , i.e. enhances the phenotype, whereas residues below the Z = 0 line have a
  , i.e. inhibits the phenotype, e.g. the presence of a certain residue with favourable chemical properties may enhance binding (
 ), whereas a residue with unfavourable properties may inhibit binding (
 ). Colour-coding: acidic [DE]: red, basic [HKR]: blue, hydrophobic [ACFILMPVW]: black and neutral [GNQSTY]: green (14).

