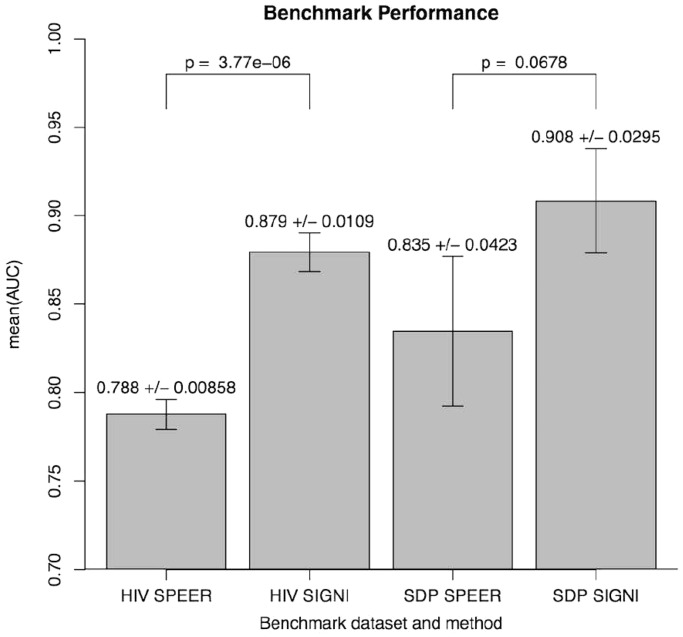
Figure 3.
Measures are mean (AUC) ± SE. Columns are: HIV [SPEER/SIGNI], SPEER and SigniSite’s predictions on the HIVdb data set. SDP [SPEER/SIGNI] SPEER and SigniSite’s predictions on the SDP data set. P-values quantifying the significance of the difference in performance were obtained using a two-tailed paired t-test.

