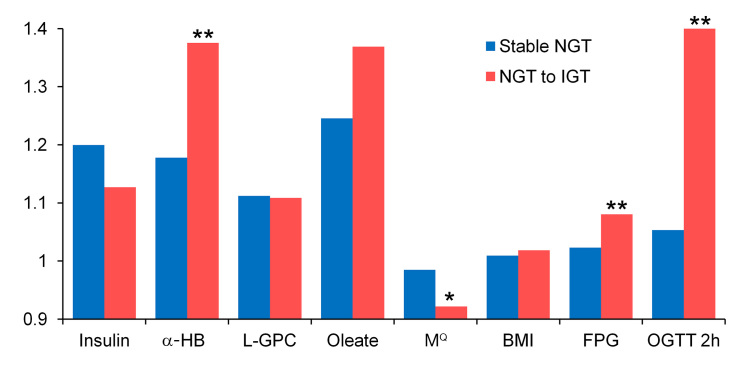
Figure 2.
Three-year average individual fold change in baseline parameters: stable NGT versus NGT to IGT progressors. Stable NGT versus NGT to IGT; the single asterisk represents p < .05 and double asterisks represent p < .005 (two-sided t-tests). N = 74 NGT to IGT; n = 759 stable NGT (subjects with complete 3 year data).

