
Figure 5.
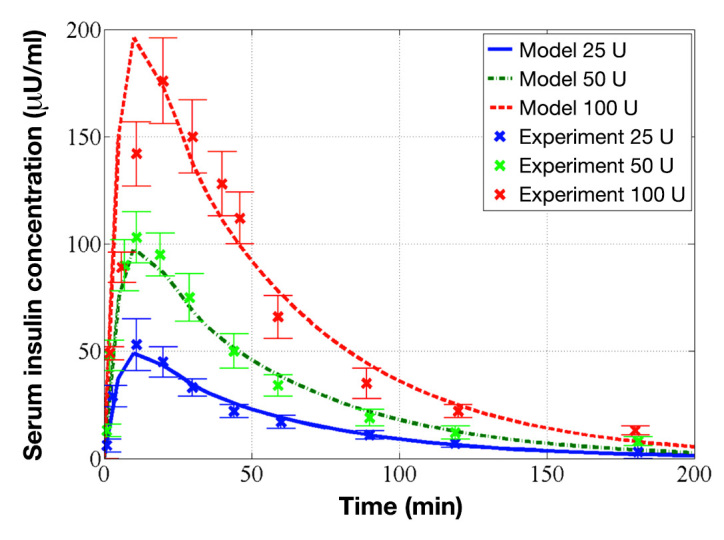
Identified pharmacokinetics of TI model and its evaluation on experimental data. The red dashed, green dashed–dot, and blue solid curves represent the model predictions for 100, 50, and 25 U, respectively, and the red × marks, green × marks, and blue × marks represent the corresponding experimental data of 100, 50, and 25 U from Rave and coauthors, respectively.31