
Figure 6.
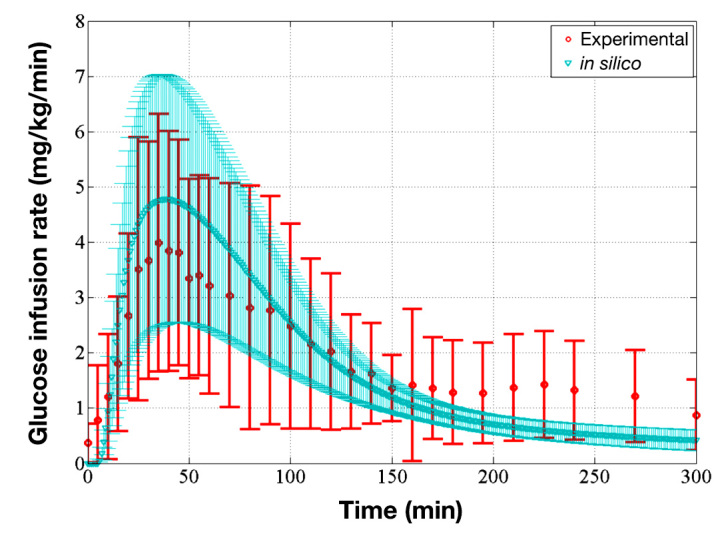
Comparison of average GIR of the in silico subjects and average GIR of the experimental participants, which validates the pharmacodynamics of the TI module. The red circles represent the average GIR of the experimental participants, and the red bars represent one standard deviation away from the average (unpublished data). The blue triangles represent the average GIR of in silico subjects, and the blue-shaded region represents one standard deviation away from the average model.