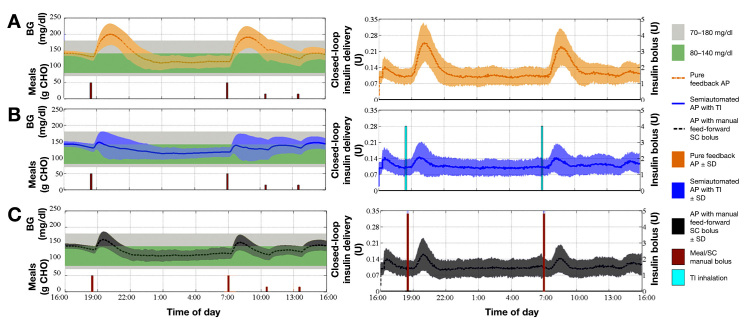
Figure 7.
Summary of BG trace and insulin delivery of 100 in silico subjects in all three cases. Left panels: Average and SD envelope of BG trace in (A) the pure feedback AP (orange dashed–dot curve and shaded region), (B) semiautomated AP with TI (blue solid curve and shaded region), or (C) AP with manual feed-forward SC bolus (black dashed curve and shaded region) cases. The sizes of the meals and snacks are also indicated (brown bars). Right panels: Average and SD envelope of insulin delivered via CSII pump in (A) pure feedback AP (orange dashed–dot curve and shaded region), (B) semiautomated AP with TI (blue solid curve and shaded region), or (C) AP with manual feed-forward SC bolus (black dashed curve and shaded region) cases. Also, the average sizes of SC manual boluses (brown bars) and the TI inhalation dosages (blue bars) are represented.

