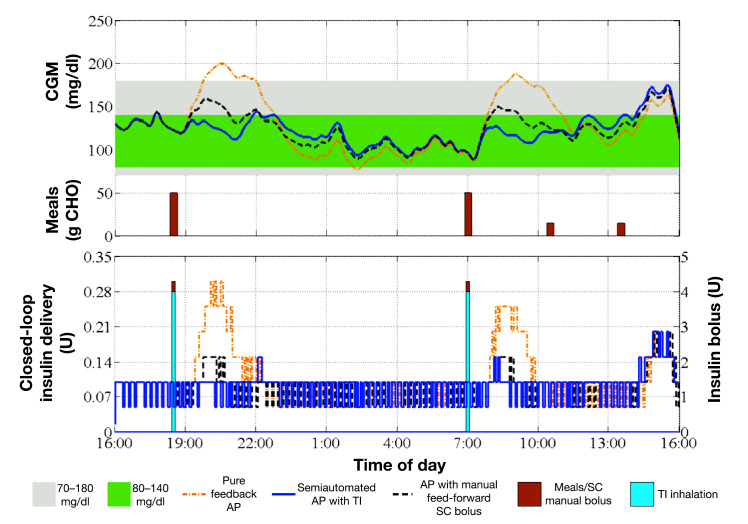
Figure 8.
Continuous glucose monitor trace and insulin delivery of a representative subject in all three cases. Top panel: CGM trace of an in silico subject for the pure feedback AP (orange dash–dot curve), the semiautomated AP with TI (blue solid curve), or the AP with manual feed-forward SC bolus (black dashed curve). Sizes of the meals are also indicated (brown bars). Bottom panel: Insulin delivered via CSII pump in the case of the pure feedback AP (orange dashed–dot curve), the semiautomated AP with TI (blue solid curve), or the AP with manual feed-forward SC bolus (black dashed curve). Also, the average size of SC manual bolus (brown bars) and the TI inhalation dosage (blue bars) are represented.

