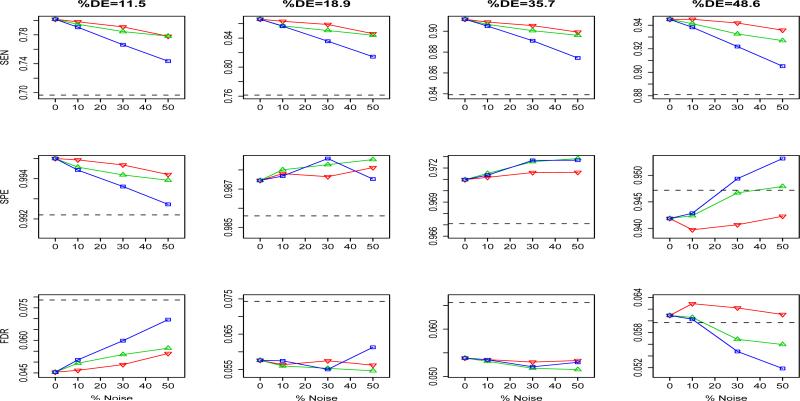
Figure 1.
Results in sensitivity, specificity and false discovery rate when the network structure is misspecified for four different sets of simulations corresponding to different proportions of DE genes. ▽: randomly deleting 10%, 30% and 50% of the true edges of the network; △: randomly adding approximately 801 (10%), 2403 (30%) and 4005 (50%) new edges to the network; □: randomly choosing 90%, 70% and 50% of the true edges and randomly adding 10%, 30% and 50% new edges to the network. The dashed line represents results without using the network structures.

