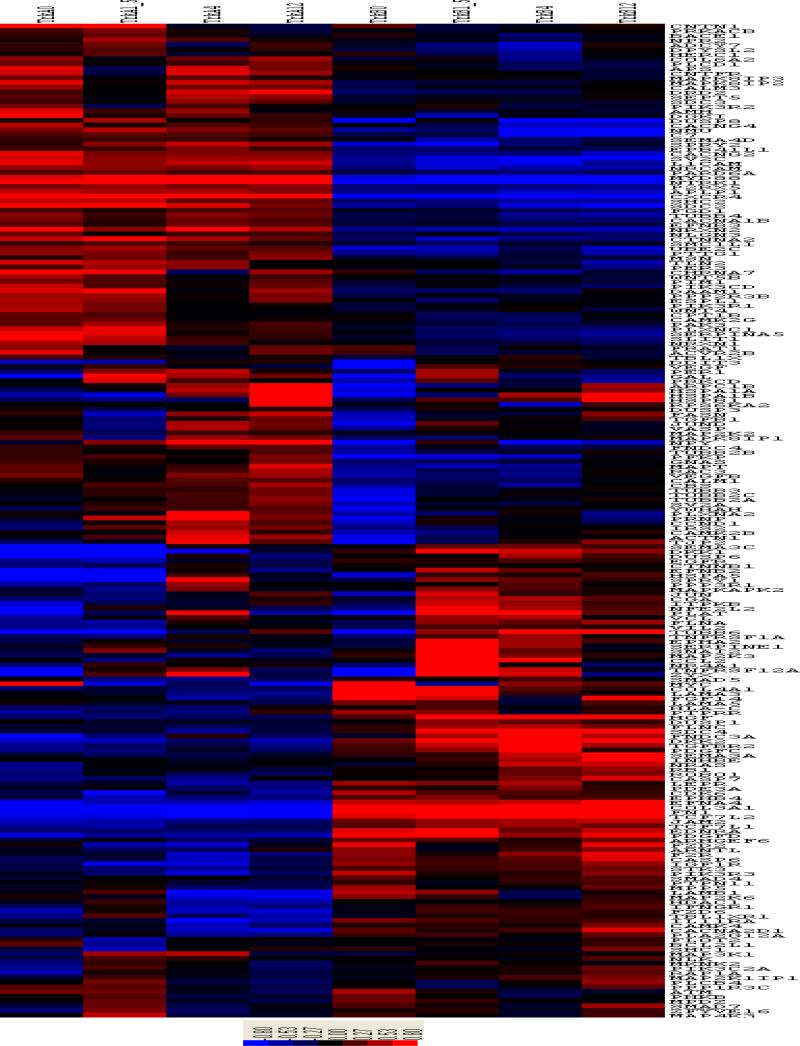
Figure 2.
Heatmap clustering plot of the 210 DE genes on the KEGG pathways, showing different expression patterns between the TrkA and TrkB time-courses. The first four columns correspond to the TrkA time course experiments at times 0, 1.5, 4 and 12 hr, the second four columns correspond to the TrkB time-course experiments at times 0, 1.5, 4 and 12 hr.

