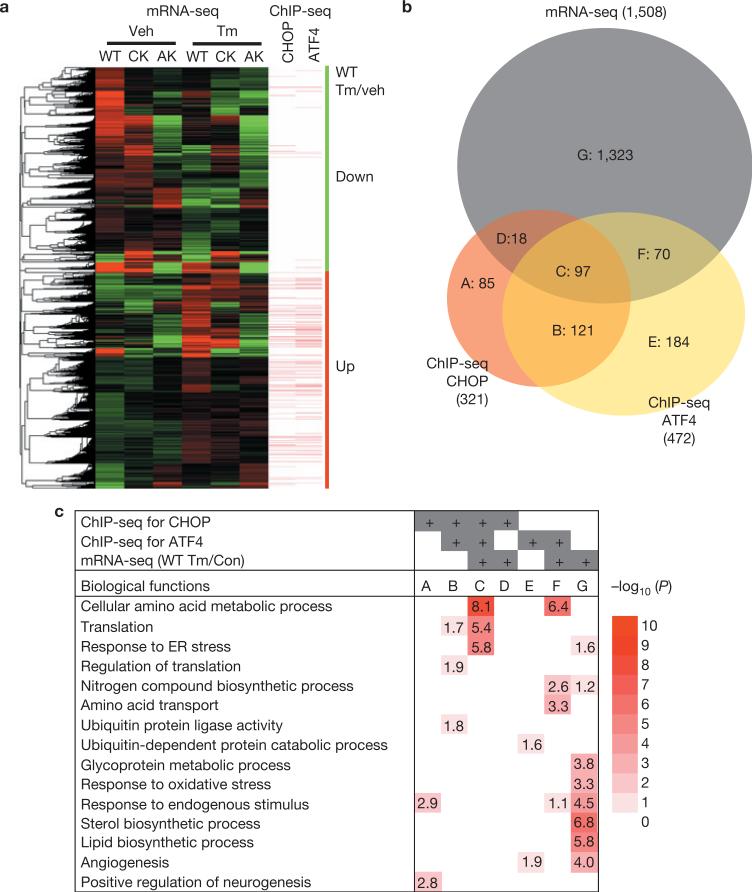
Figure 2.
ATF4 and CHOP upregulate expression of genes encoding protein synthesis and UPR functions. (a) Clustered mRNA-seq expression data presented in a heat map with ChIP-seq peaks aligned. Tm-induced and -repressed genes in WT, Chop–/– (CK), and Atf4–/–-(AK) MEFs are shown. Genes containing ATF4- and CHOP- binding sites <3 kb from the TSSs are denoted by bars. Green vertical bar represents downregulated genes, whereas red vertical bar represents upregulated genes in WT MEFs in response to Tm (2 μg ml–1) when compared with vehicle (dimethylsulphoxide). (b) Venn diagram illustrating overlaps of gene sets from mRNA-seq and ChIP-seq for ATF4 and CHOP. A: genes bound by CHOP without expression changes in response to Tm (2 μg ml–1). B: genes bound by both ATF4 and CHOP without expression changes. C: genes bound by both ATF4 and CHOP with differential expression. Genes in C are shown in Supplementary Table S4. D: genes bound by CHOP that exhibit differential expression. E: genes bound by ATF4 that do not change expression. F: genes bound by ATF4 that exhibit differential expression. G: genes with differential expression but do not bind ATF4 or CHOP. (c) Functional enrichment analysis of gene sets in b. The EASE scores of DAVID functional enrichment of selected GO terms are represented in a heat map with –log10 (EASE score) as a colour index and number. White corresponds to an EASE score of 1.0 (no number in the block) with no statistical significance; dark red corresponds to an EASE score of 1.0×10⁻¹⁰ or lower.

