
Fig. 1.
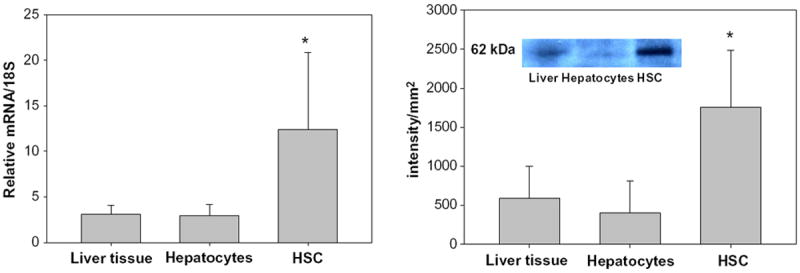
Relative levels of expression of Bcmo1 mRNA (left panel) and protein (right panel) in whole mouse liver, primary mouse hepatocytes and primary mouse HSCs. The insert in the right panel shows an immunoblot used to obtain BCMO1 protein levels for one liver, one hepatocyte and one HSC preparation. Values are given as the mean ± 1 S.D. for 5 livers or cell isolates in each group. The “*” indicates significantly different (p < 0.05) compared to the liver level.