
Fig. 2.
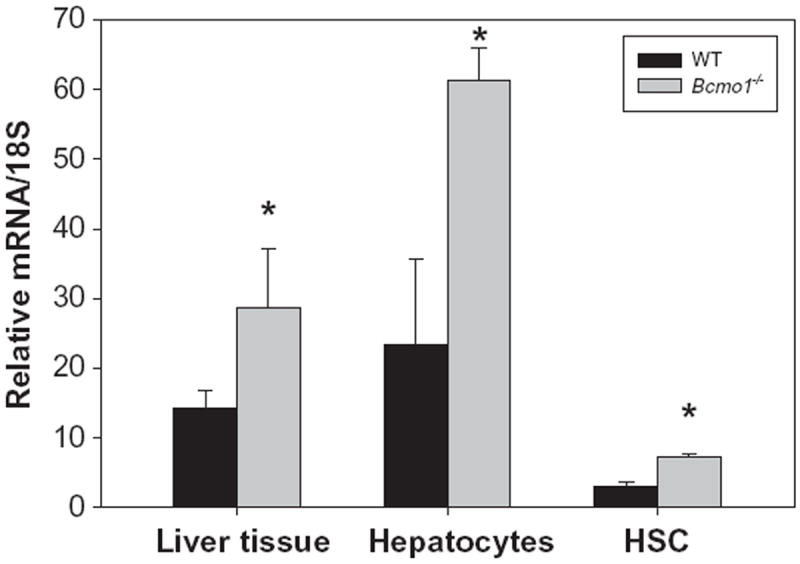
Relative expression levels of Bcmo2 mRNA in whole mouse liver, primary hepatocytes and primary HSCs for wild type (black bars) and Bcmo1-deficient (gray bars) mice. Values are given as the mean ± 1 S.D. for 5 livers, 4 hepatocyte isolates, and 4 HSC isolates. The “*” indicates significantly different (p < 0.05) compared to the liver or cells obtained from wild type mice.