
Fig. 3.
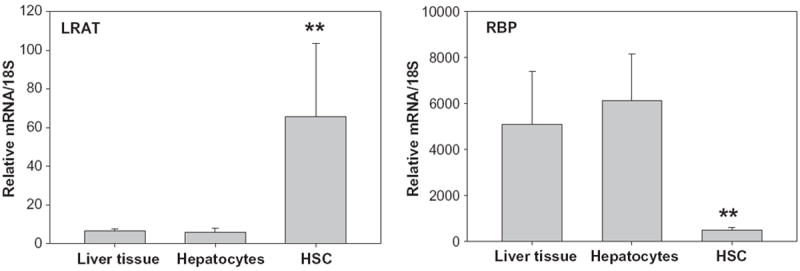
Levels of mRNA for LRAT (a marker for HSCs) and RBP (a marker for hepatocytes) in whole liver, primary hepatocytes and primary HSCs. Values are given as mean ± 1 S.D. for 5 livers or cell isolates per group. The “**” indicates significantly different (p < 0.01) compared to liver or cells from wild type mice.