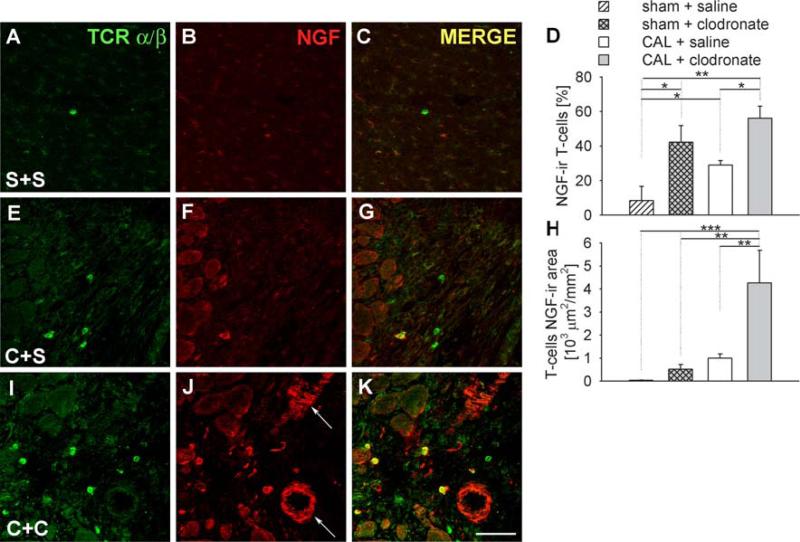
Fig. 8.
Effect of clodronate liposomes on NGF expression by T cells. Immunostaining for TCR α/β as a T cell marker (a, e, i), and co-stained for NGF (b, f, j), merged images (c, g, k). Sections were obtained from rats receiving sham ligation and saline injections (S+S, a–c), coronary artery ligation and saline injection (C+S, e–g), or coronary artery ligation plus clodronate liposomes (C+C, i–k). Arrows shows blood vessels expressing NGF. Scale bar 50 μm. Quantitative analysis of the percentage (d) and the area (h) of T cells expressing NGF-ir as determined by the area of TCR α/β-ir coexpressing NGF-ir. * P < 0.05, ** P < 0.01, *** P < 0.001

