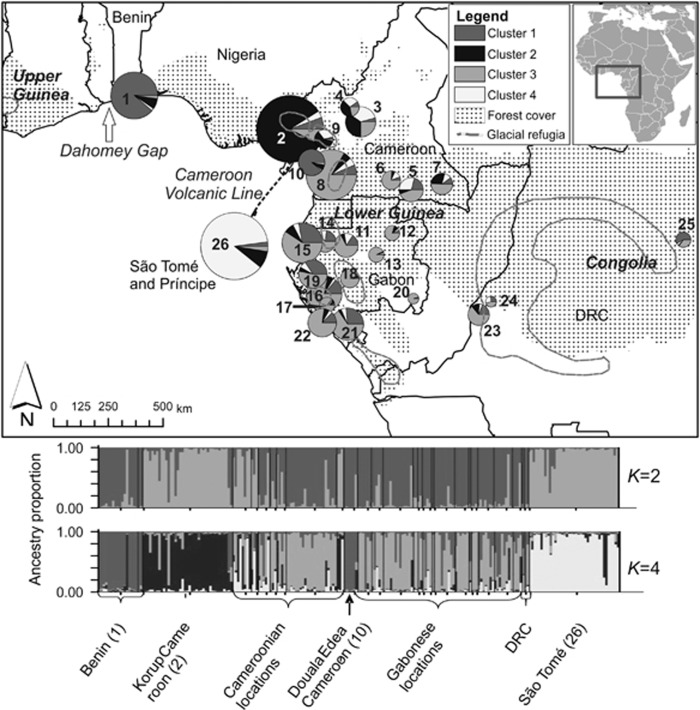
Figure 1.
Above: Map of the geographical distribution of GPs identified by STRUCTURE (K=4 clusters) for S. globulifera in Atlantic Equatorial Africa and postulated refuge locations (areas limited with grey lines) during the last glacial maximum (LGM, about 18 000 years BP) adapted from Maley (1996). Numbers correspond to sampling locations in Table 1. Chart size increases with sample size (ranging from 1 to 39 individuals). Regional names are given in italics. Below: Bar plots showing STRUCTURE ancestry proportions in K=2 and K=4 clusters. Each individual is represented as a line segment, which is vertically partitioned into K coloured components representing the individual's estimated proportions of ancestry in the K clusters. DRC, Democratic Republic of the Congo.

